Creating a chart is one of the most effective ways to visualize data and if you are on Google Sheets, you have the freedom to create a chart and graphically represent the data exactly the way you want. One such chart is a funnel chart that is basically used to represent linear processes with the stages sequentially connected to each other in tandem, and the final result is known.
Say, for example, a funnel chart can be used to represent the number of candidates passed in different stages of a selection process before ultimate selection. However, unlike other charts, creating a funnel chart in Google Sheets is a little tricky, and there’s no direct way to build a funnel chart. That said, today I will talk about how to make a funnel chart in Google Sheets.
As there’s no direct way to build a funnel chart in Google Sheets, I will discuss the method to create precise funnel charts for your needs.
To explain the method, I will be creating a funnel chart to display the number of candidates selected by a company in a recruitment process starting from the number of applicants. As this is a linear process, we can create a funnel chart to graphically represent this process.
Funnel chart in Google Sheets on the web and Android
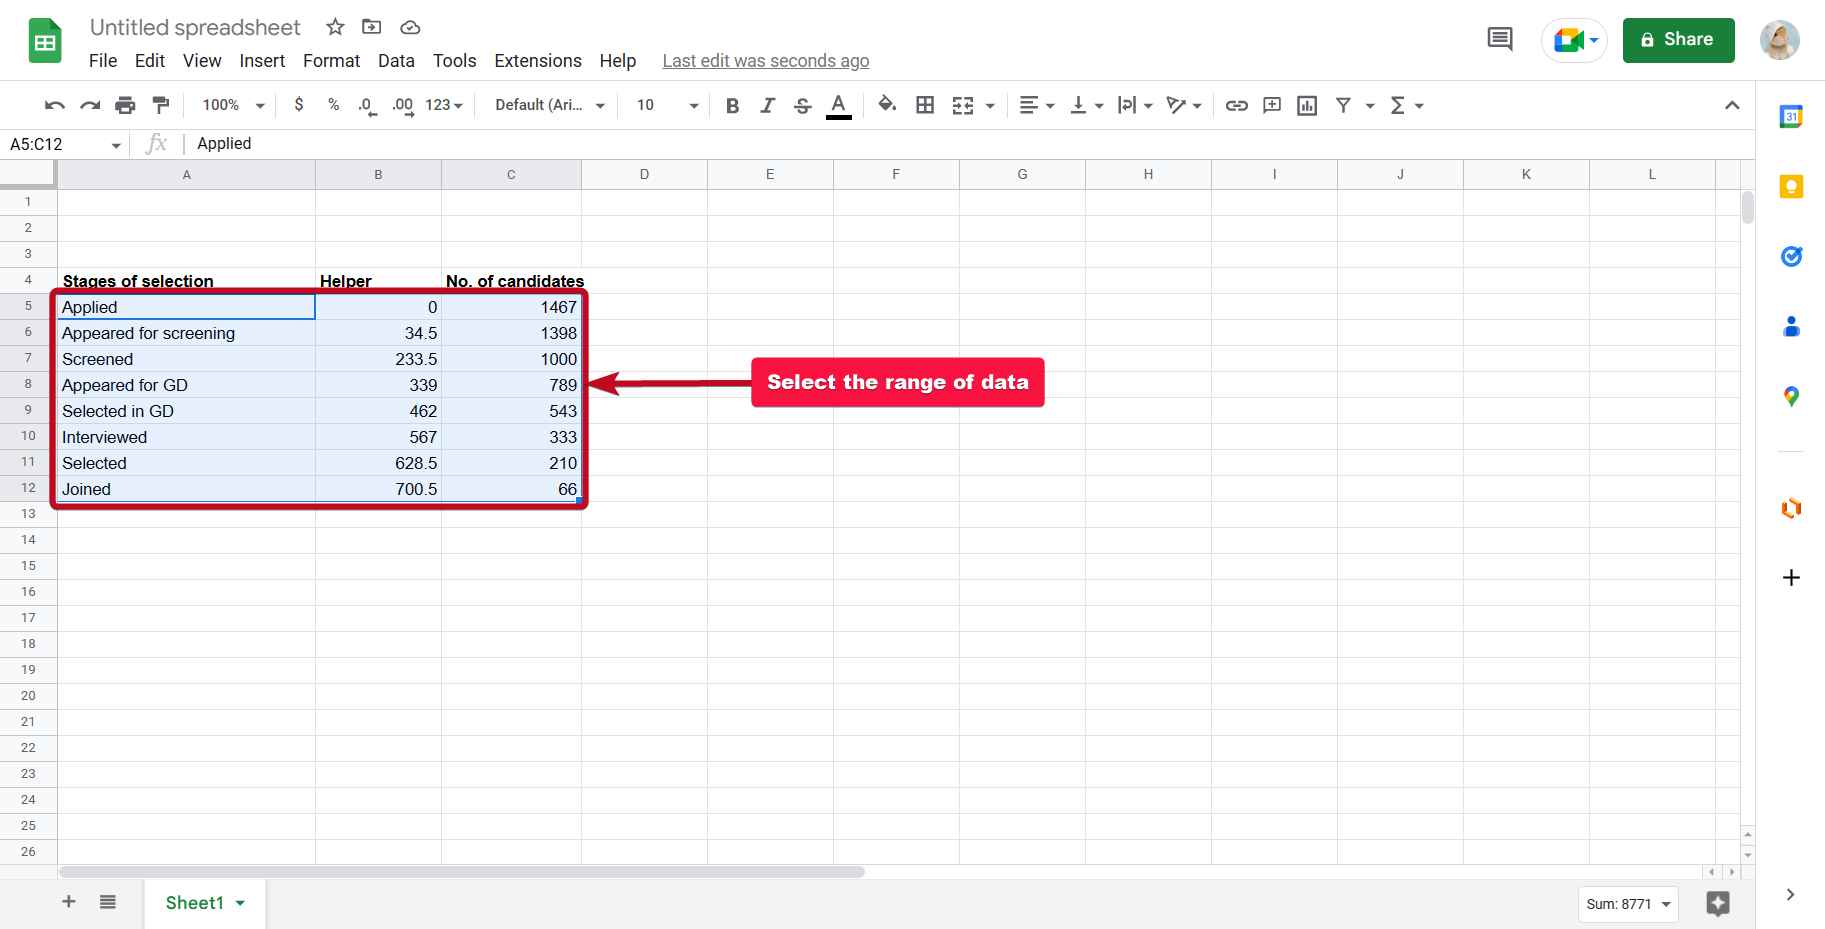
Step 1: To create a funnel chart in Google Sheets you have to create a helper column with approximate values that are increasing at every step.
In the screenshot below, column ‘B’ is the column for the helper values. Now, select the data set. Here, I have selected all the cells starting from A5 to C12. You have to exclude the headings if they exist.
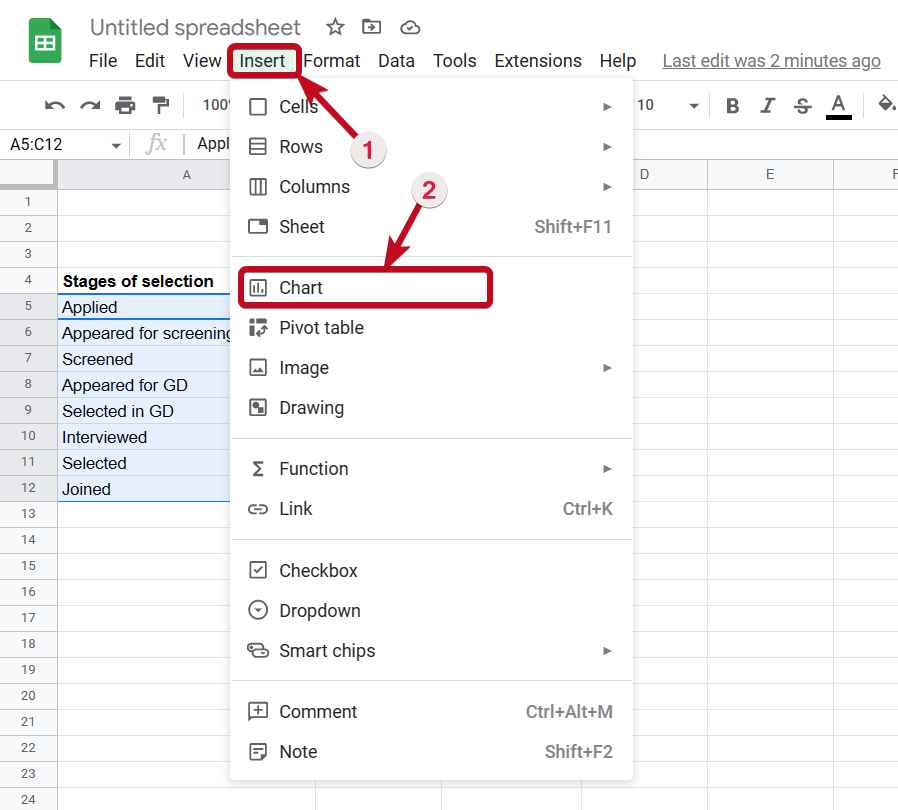
Step 2: Now, click on ‘Insert’ and then click on ‘Chart’.
Step 3: The Chart Editor panel will open up on the right side of Google Sheets. Under the ‘Setup’ tab that should be open by default, click on the drop-down menu corresponding to ‘Chart type’ and click on ‘Stacked bar chart’.
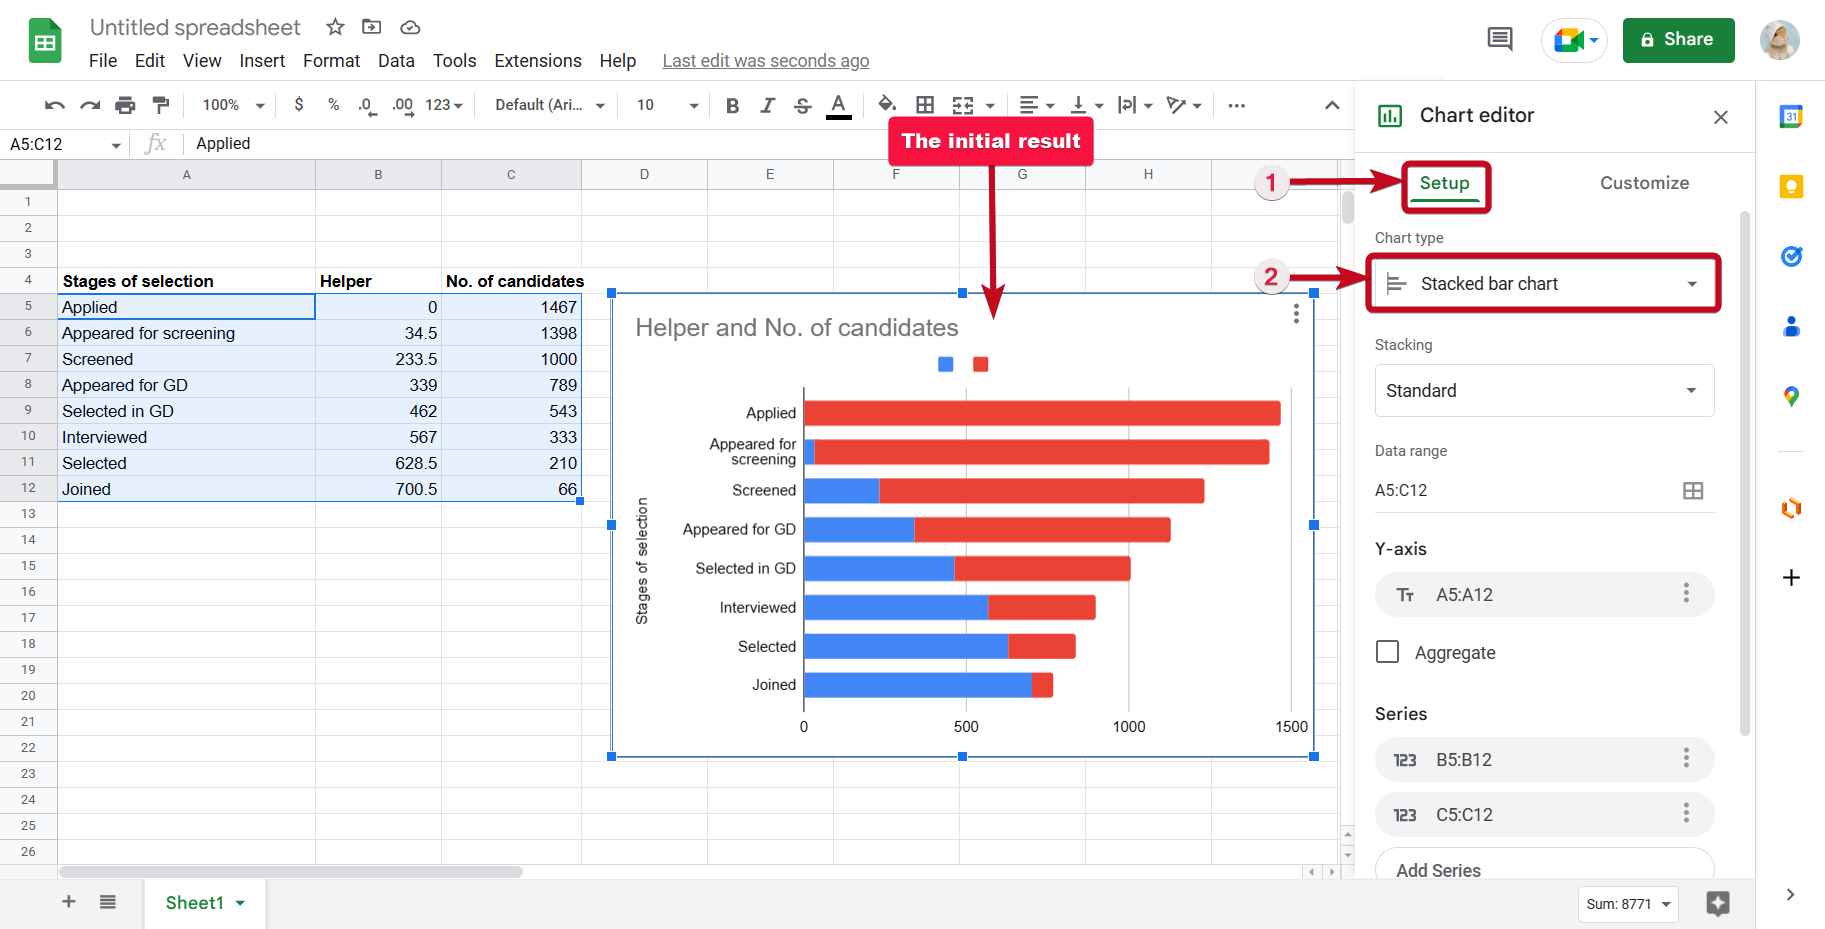
Step 5: In the stacked bar chart, one bar will correspond to the values in the helper column, while the other will correspond to the actual values.
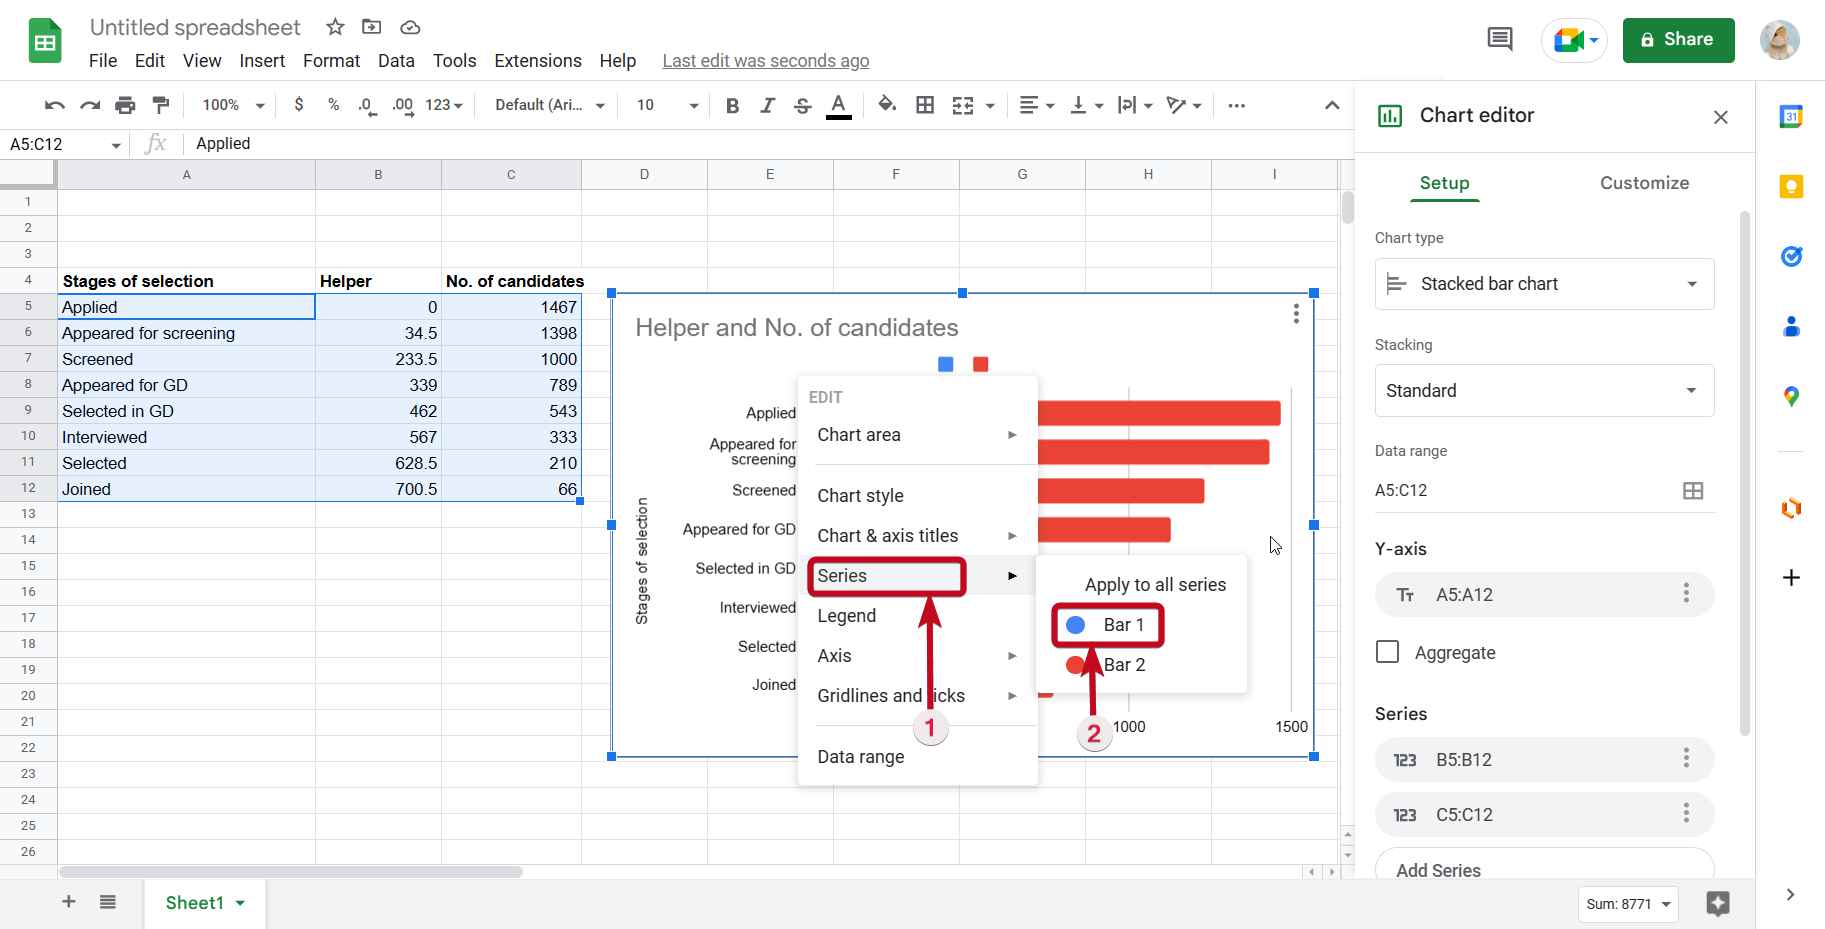
Now, the most important step! What we have to do here is, make the first bar transparent.
Simply right-click on the chart, hover to ‘Series’, and then click on ‘Bar 1’.
Step 6: Click on the drop-down menu just below ‘Fill opacity’ on the ‘Chart editor’ panel and set it to ‘0%’.
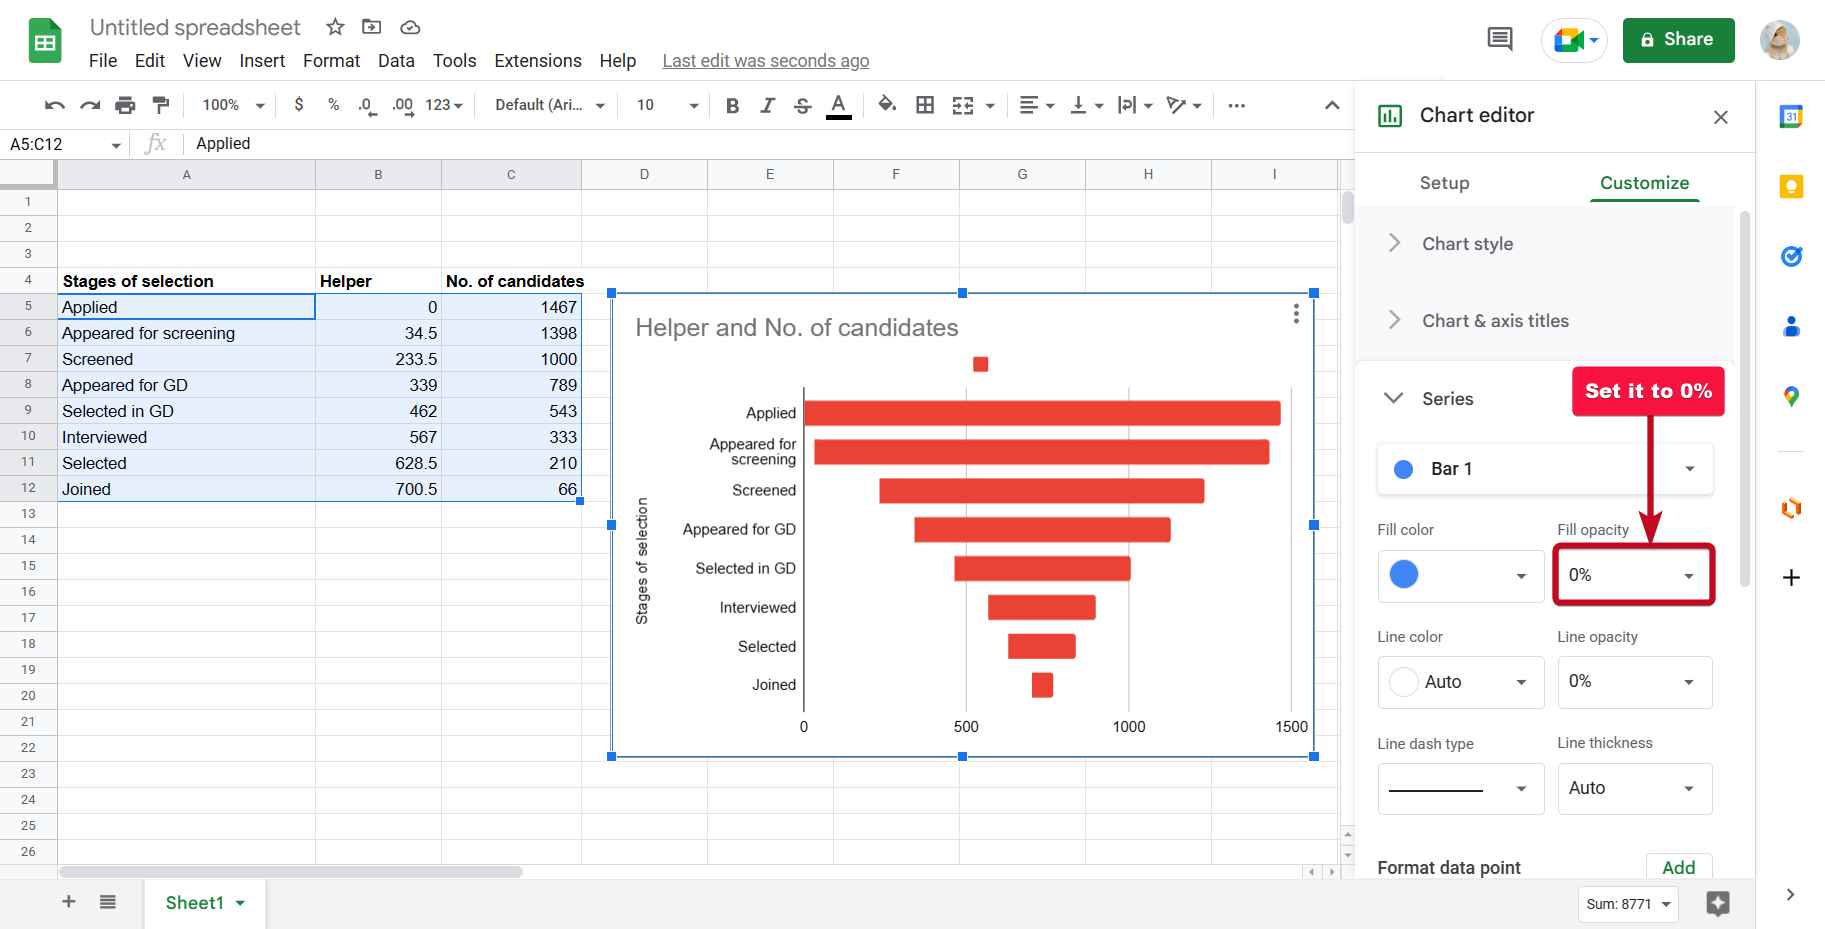
The funnel chart is ready based on your process.
If you think the funnel chart isn’t totally precise, you can tweak the values in the helper column, or here’s the formula that you can use to populate values in the helper column.
=(max($C$5:$C$12)-C5)/2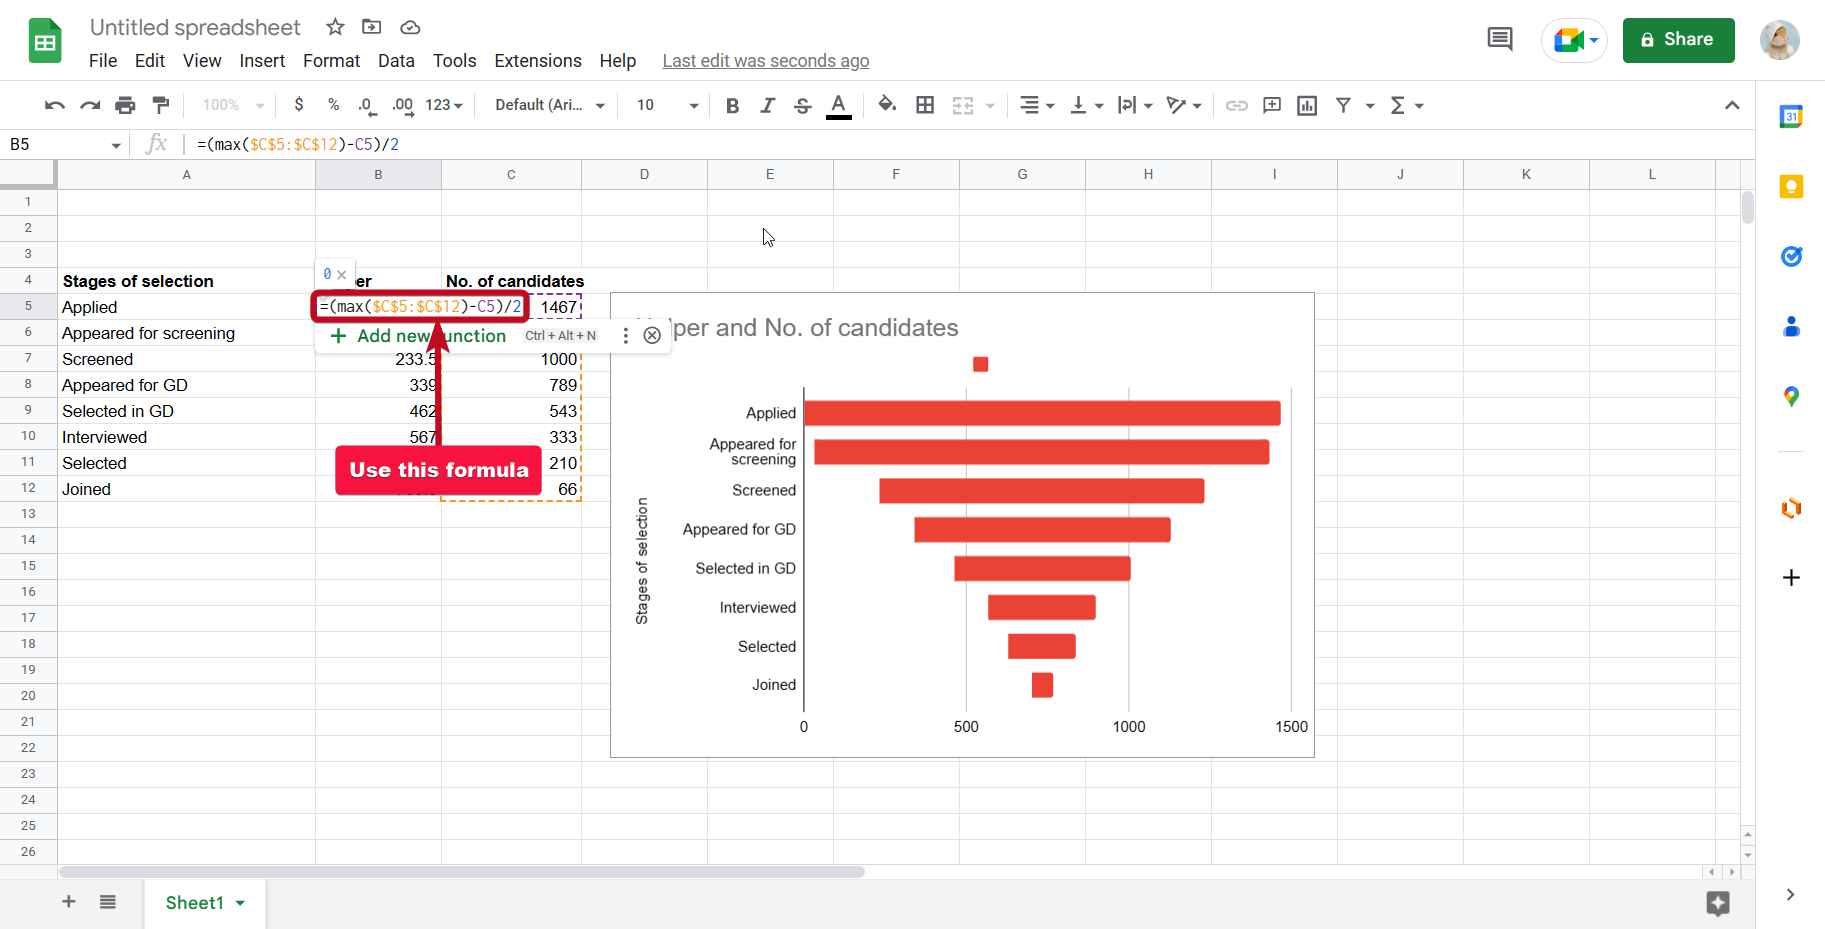
To explain the formula in simple words, you are supposed to find the maximum value in the data column, which is the value in the initiating step of the process. Then you have to subtract the value in the data column from that maximum number and divide it by 2. The number that you get should be the value for the specific cell in the helper column.
Simply replace C, 5, and 12 with the range of your data.
Just like other charts in Google Sheets, you can customize the chart exactly the way you want. You can change the chart title, colors, and much more.
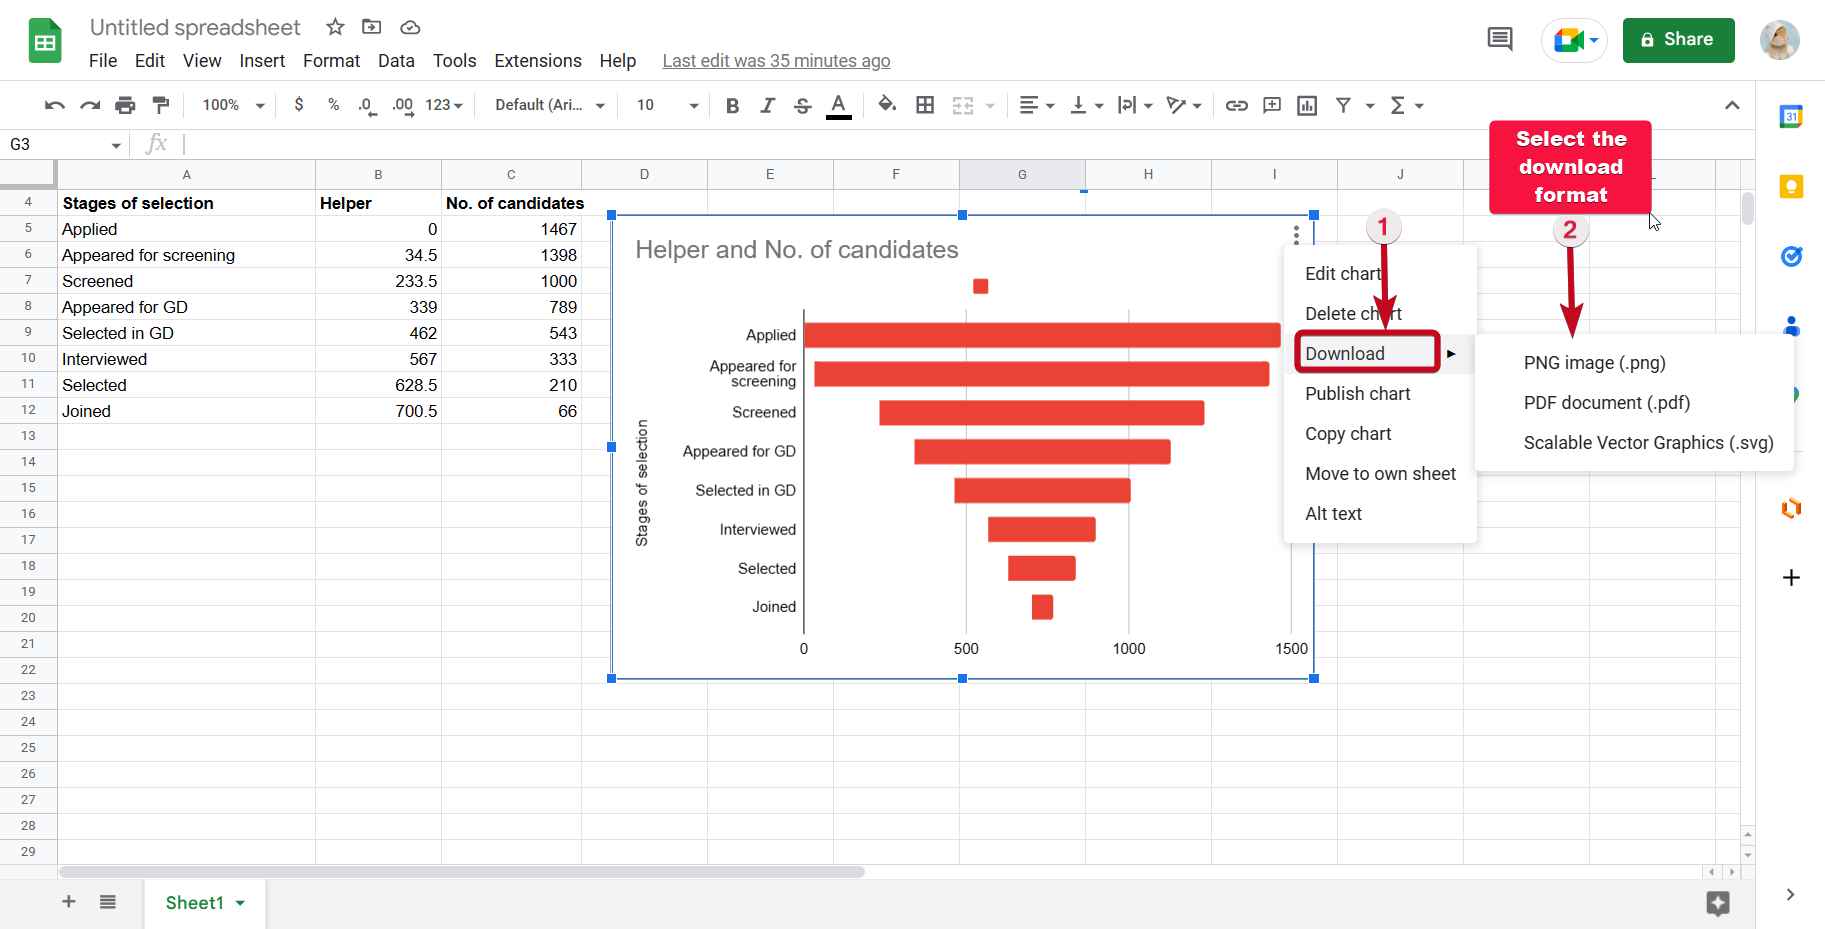
Now that you have the chart, you can save the chart for use in presentations, and projects, or get a hard copy if you want to submit physical reports.
To download the chart, click on the triple-dot icon on the chart, hover over to ‘Download’, and then select PNG, SVG, or PDF, based on your requirements.
You can create a funnel chart in Google Sheets even with Google Sheets extensions. However, the methods I have discussed here do not require any extensions, and hence, you can create the chart anywhere and on any device. It is the beauty of this method of creating a funnel chart on Google Sheets.
So, that’s how to make a funnel chart in Google Sheets. Hope that was helpful to you. Do you have any questions? Feel free to comment on the same below.
Related Posts
How to Archive a WhatsApp Conversation Without Deleting
How to Clear or Delete Archived Emails in Gmail
How to Clear Google Search History?
2 best Android Apps to open zip or archive files on the smartphone
How to use the XLOOKUP function in Microsoft Excel with Example
How to set up an out-of-office responder on Gmail? Step-by-step guide on setting up a Vacation responder